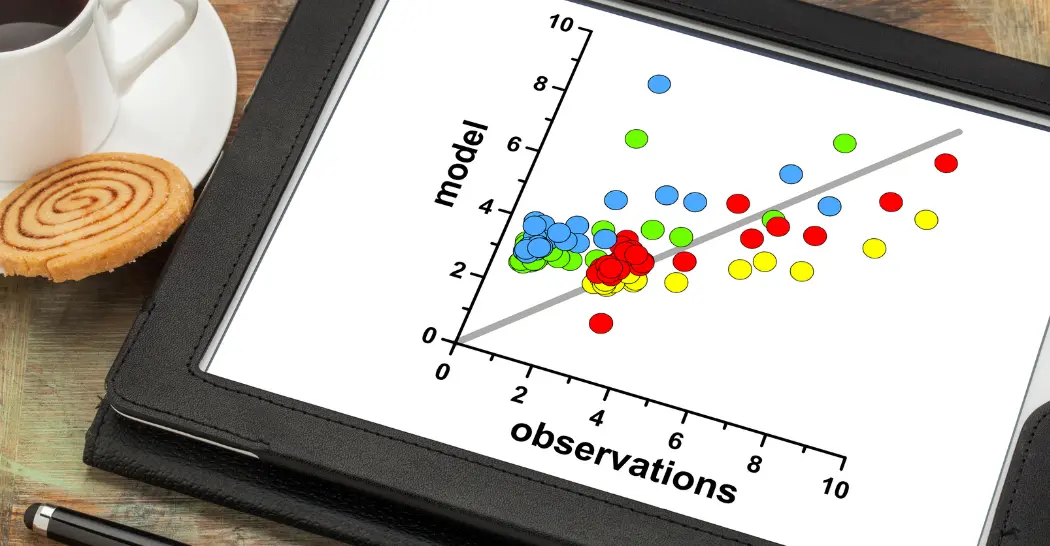
Scientific observations are systematic and objective data collection processes that aim to gather information about the natural world. These observations serve as the foundation for scientific research and contribute to the development of theories and understanding of various phenomena. Scientific observations can be broadly categorized into two main types: qualitative observations and quantitative observations.
Collecting quantitative data is all about gathering numeric information that can be measured, counted, or otherwise expressed in numbers. This data is particularly useful for conducting statistical analysis and generating insights through patterns and trends. Here are some of the most common methods for collecting quantitative data:
Surveys and Questionnaires: This is perhaps the most popular method, involving structured questions with defined answer options like multiple-choice, scales, or yes/no. These surveys can be conducted online, on paper, through phone calls, or even face-to-face interviews. The key is to use clear and concise questions that elicit numeric responses.
Example: A researcher is studying consumer preferences for a new product. They design a survey with questions about product features, pricing, and satisfaction levels. Participants rate each aspect on a numerical scale (e.g., 1 to 5).
Experiments: Controlled experiments allow researchers to isolate variables and observe their effects. By manipulating specific conditions and measuring the outcomes, researchers can gather quantitative data on cause-and-effect relationships. This method is often used in scientific research and testing.
Example: A pharmaceutical company is testing the effectiveness of a new drug. They conduct a randomized controlled trial where participants are randomly assigned to receive either the new drug or a placebo. The quantitative data collected includes measurements of health outcomes such as reduction in symptoms or improvement in test scores.
Observation Studies: Structured observations focus on recording specific behaviors or occurrences and quantifying them. This could involve counting the number of times a specific action happens, measuring the duration of an event, or recording specific details during a controlled observation.
Example: A sociologist wants to study playground behavior in children. They systematically observe and record instances of aggression on the playground over a period of time, assigning numerical values to the frequency and intensity of aggressive behaviors.
Document Review: Existing documents like records, reports, and databases can be valuable sources of quantitative data. Researchers can analyze these documents to extract numerical information like sales figures, website traffic, or patient statistics.
Example: A climate scientist is studying historical temperature trends. They use data from existing meteorological databases to analyze temperature records over the past century.
Secondary Data Sources: Publicly available datasets from government agencies, research institutions, and private companies can also be used to collect quantitative data. These datasets often cover a wide range of topics and can be extremely valuable for research and analysis.
Example: Market Research Using Existing Reports
Imagine a company is considering launching a new line of smartphones. Instead of conducting a new survey or experiment, they decide to utilize secondary data sources to gather relevant information:
- Existing Market Reports: The company searches for previously published market research reports on the smartphone industry. These reports may contain data on market trends, consumer preferences, and competitor analysis.
- Government Publications: They explore statistical data published by government agencies, such as smartphone adoption rates, demographic information about smartphone users, and economic indicators that might influence consumer purchasing behavior.
- Industry Publications: The company looks into trade publications and industry journals for insights into technological advancements, potential challenges, and emerging opportunities within the smartphone market.
- Competitor Annual Reports: Annual reports of competitors in the smartphone industry provide valuable data on their market share, financial performance, and product strategies.
- Online Databases: The company leverages online databases that compile data relevant to the smartphone market, such as user reviews, sales figures, and social media mentions.
By gathering and analyzing data from these secondary sources, the company can gain a comprehensive understanding of the smartphone market without conducting a new, resource-intensive study. This approach allows them to make informed decisions and refine their strategy based on existing information.
Choosing the right method depends on various factors like the research question, target audience, budget, and desired level of precision. Each method has its own strengths and weaknesses, so it’s important to carefully consider the best approach for your specific needs.
Here are some additional points to remember about collecting quantitative data:
- Sampling: It’s often impossible to collect data from every member of a population, so researchers typically draw a representative sample to gather information. Ensuring a good sampling technique is crucial for obtaining accurate and generalizable results.
- Validity and Reliability: Data should be valid (measuring what it’s supposed to) and reliable (consistent and repeatable). Careful design and implementation of data collection methods are essential for ensuring data quality.
- Ethical Considerations: Respecting participant privacy and informed consent are crucial considerations when collecting data, especially from human subjects.


