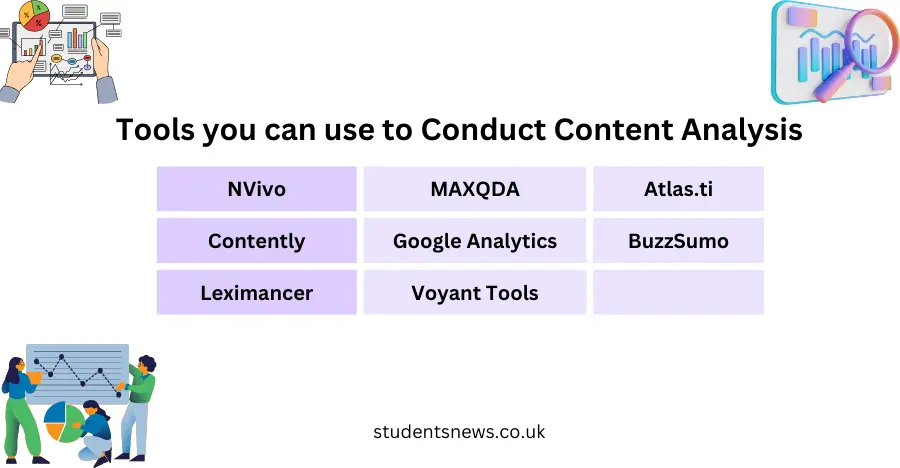
Content analysis is a powerful research method that allows researchers to systematically analyze and draw meaningful insights from various forms of communication using certain tools and softwares.

In this article, we will walk through the step-by-step process of conducting content analysis using a real-world example: analyzing Twitter posts to understand public sentiment about the popular technology product, “TechX.”
Step 1: What are We Looking For? Define Your Focus
Let’s start simple. What’s the burning question? In our case, we want to know how people feel about TechX. Clear, right? Your first step is defining your focus, making sure it’s not as broad as the ocean but not as narrow as a puddle.
Step 2: Where to Look? Choose Your Content Sample
Imagine looking for clues in a haystack. Now, imagine the haystack is Twitter, and the clues are tweets about TechX. We’re not reading every tweet; we’re picking a slice, say 100 tweets, to get a flavor of what people are saying.
Step 3: Cracking the Code: Develop a Coding Scheme
Coding sounds complicated, but it’s just a way of putting things into categories. For TechX, we’re creating categories like “Positive Sentiment,” “Negative Sentiment,” “Neutral Sentiment,” “Feature Mentions,” “User Experience,” and “Price-related Comments.” Simple, right? It’s like sorting your closet, but with tweets.
Step 4: Team Up (If You Can): Train Coders
If you’ve got friends on this adventure, make sure everyone understands the categories. Train them with examples. A tweet saying “New #TechX has an amazing camera!” is both “Positive Sentiment” and a “Feature Mention.”
Step 5: Dive In: Code the Content
This is where the detective work begins. Read your 100 tweets and assign the right labels. “TechX battery lasts forever” might be a “Positive Sentiment” and a “Feature Mention (Battery).” Easy, right?
Step 6: Count the Clues: Analyze the Data
Count how many times each category appears. You might find 50 positive sentiments, 20 negative sentiments, and 30 feature mentions. The numbers start telling a story.
Step 7: The Story Unfolds: Interpret the Findings
Now, look at your numbers. What’s standing out? In our TechX example, we might notice that many positive sentiments are tied to specific features, like the camera or battery life.
Step 8: Tell the Tale: Report Your Findings
Time to weave the narrative. Create a report summarizing what you found. Share that most tweets about TechX are positive, and users love talking about the camera.
Step 9: Face the Reality: Reflect on Limitations
Every hero has its flaws, and so does content analysis. Maybe not everyone uses #TechX; perhaps you’re missing tweets in other languages. Acknowledge these limitations like a seasoned explorer.
Our Example
In the bustling world of Twitter, we set sail to discover sentiments about TechX. First, we defined our goal – understanding how people feel about this smartphone. Then, we picked our vessel – 100 tweets with #TechX. Our coding scheme became our map, leading us through categories like Positive, Negative, Neutral, Features, User Experience, and Price.
We recruited our fellow explorers, trained them to understand the map, and dived into the sea of tweets. Each tweet was a treasure, and we assigned labels like Positive for tweets expressing love and Features for those talking about TechX’s amazing camera.
The counting began, and the data started telling us stories. Positive sentiments were abundant, and the camera seemed to be the star. Tweets painted a picture of users being particularly thrilled about TechX’s camera quality.
We interpreted these findings, concluding that, on Twitter, people generally love TechX, with the camera stealing the spotlight. Our report was our final chapter, summarizing our discoveries for the world to read.
Yet, we had to face reality. Twitter is vast; not everyone uses hashtags, and language barriers exist. Our adventure had its limitations. But, armed with this knowledge, we returned wiser and ready for the next exploration.
Conclusion: Navigating the Content Sea
Content analysis might sound like a complex journey, but it’s an adventure anyone can embark on. Define your path, pick your sample wisely, create a simple coding scheme, and let the numbers tell you stories. Our TechX example illuminated the steps, making content analysis less like finding a needle in a haystack and more like an exciting treasure hunt in the vast sea of information. Happy exploring!


[…] the sheer volume of content generated online can be overwhelming. Every marketer should know how to conduct content analysis. This is where content analysis tools come into play, offering marketers invaluable insights to […]
[…] You can read a detailed article on doing content analysis with an example here. […]